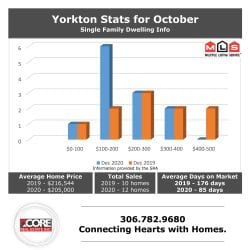
October 2020 Market Stats
November 17, 2020 3:51 pm October was a busy month in the Yorkton Real Estate Market. Sales in were up 36.8%, going from 19 in October 2019 to 26 in October 2020.
This means sales were 31.3% above the 5-year average (and 34.7% above the 10-year average).
Year-to-Date (YTD) sales in rose 31.0% over last year, increasing from 168 to 220. That’s a lot of houses selling during COVID.
The number of new listings in Yorkton for October 2020 stayed flat at 29 (8.8% below the 5-year average and 7.9% below the 10-year average).
YTD new listings in the city fell 9.5%, going from 402 to 364. Active listings fell 28.2% in Yorkton (down from 181 to 130). This had made it a little challenging for buyer for there has been less options to consider but great for sellers.
Homes in Yorkton stayed on the market an average of 76 days in October—down 30.9% from 110 days last year (but below the 5-year average of 89 days and below the 10-year average of 80 days). Plenty of opportunity for those people wanting to sell.
Median home prices in Yorkton went from $202,500 to $194,500 (a decrease of 4.0%) and were approximately 9.3% below the 5-year and 9.0% below the 10-year average median price. Year-to-date, the median home price in Yorkton was $206,275 which is 4.7% below the $216,463 price from the same time last year.
Categorised in: A Word From Our Broker
This post was written by teamcore

